Evaluating Probabilistic Predictions: Proper Scoring Rules
Point predictions are often insufficient for machine learning tasks that involves uncertainty. As a solution, probabilistic models are becoming more widely used. This post talks about proper scoring rules, a framework to think about and evaluate probabilistic predictions.
Probabilistic Predictions / Predictive Distributions
Predictive distributions are when a model produces a probability distribution (as opposed to a point prediction) given data and parameters. They have many benefits - many real world problems have inherent uncertainty, and we can capture thing we care about, like risk or reward, through a probabilistic representation. With predictive distributions, we can have better uncertainty quantification, and make better decisions given these uncertainties.
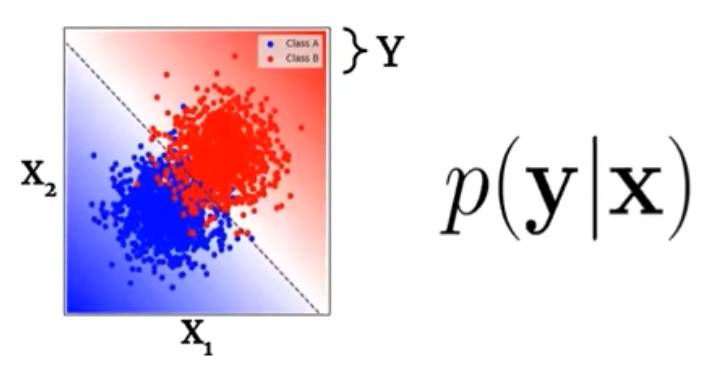
To put in perspective, for input \(X\), instead of outputting a point prediction \(y\), the model outputs a distribution over the space of outputs \(p(y\vert X)\).
For example, for a classification task, we can output confidence along with a label:
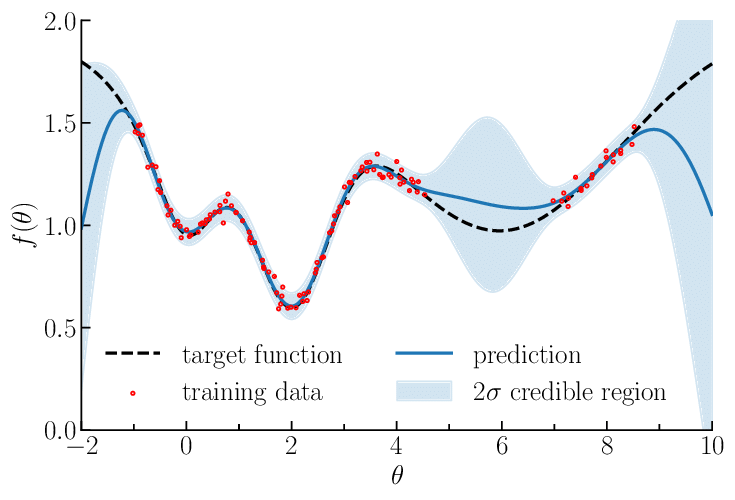
For regression, one can output a gaussian distribution over \(y\) (mean and variance), like in the case of Gaussian Process regression:
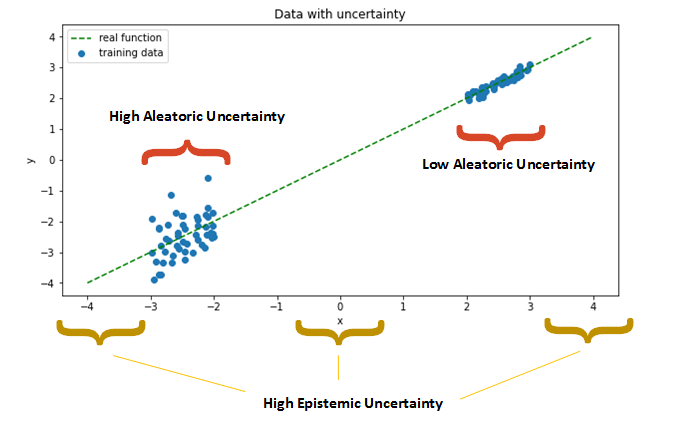
Uncertainties can be from different sources. The most mainstream distinction is aleatoric (there exists variations in the data, as in our classification example) vs epistemic (we don’t have enough data to know the label for sure, as in our regression example).
Calibration and Accuracy
In general, we want two thing from our probabilistic forecasts: calibration, and accuracy. Calibration refers to that the probabilities predicted actually corresponds to the true probabilities. For example, among the days that we predict 30% precipitation rate, 30% of them actually rained.
In the machine learning community, many studies have shown that as neural networks get deeper, they become less calibrated. So there have been efforts to calibrating neural networks using techniques like ensembles and temporal scaling, among others. This is still an active area of study.
An important note is that calibration is not the same thing as accuracy. A model can be perfectly calibrated but completely useless - for example, for a binary classification task with a balanced test set, a model that predicts class A always with \(50\%\) probability.
Evaluating probabilistic forecasts, then, requires evaluating both accuracy and calibration. This is where proper scoring rules come in.
Proper Scoring Rules (PSR)
Definition
Scoring rules are functions that score how well a predictive distribution captures data. Let’s say we have data domain \(x \sim \mathbf{X}\), and \(P\) is a distribution over \(\mathbf{X}\). Then the score
\[S: P \times x \rightarrow \mathbb{R}\]It assess the quality of probabilistic forecasts, by assigning a numerical score based on the predictive distribution and on the event or value that materializes. A scoring rule is proper if the forecaster maximizes the expected score for an observation drawn from the distribution \(F\) if he or she issues the probabilistic forecast \(F\), rather than \(G = F\). It is strictly proper if the maximum is unique.
Common Scoring Rules
Negative Log Likelihood (NLL)
You probably know what NLL is. In addition to being a proper scoring rule, it also have optimal discrimination power.
\[NLL = -\sum_{i=1}^{n} \left[ y_i \log(p(y_i)) + (1 - y_i) \log(1 - p(y_i)) \right]\]Brier/Quadratic Score
Brier score is a PSR for classification tasks. It is sometimes preferred over NLL because it is bounded within \([0,1]\) and hence more stable.
In the binary setting, we can calculate it as:
\[BS = \frac{1}{n} \sum_{i=1}^{n} (p_i - o_i)^2\]- \(n\) is the total number of observations or data points.
-
\(p_i\) represents the predicted probability of the positive class for the i-th observation.
- \(o_i\) is an indicator variable that equals 1 if the event occurred and 0 if it did not for the i-th observation.
Continuous Ranked Probability Score (CRPS)
Continuous Ranked Probability Score (CRPS) is another metric widely used in fields like meteorology, hydrology, and climate science. In plain words, the CRPS measures the discrepancy between the predicted cumulative distribution function (CDF) of a forecast and a step function representing the true outcome. It essentially quantifies the spread of the forecast distribution around the observed value.
The Continuous Ranked Probability Score is defined as:
\[CRPS(F, y) = \int_{-\infty}^{\infty} [F(x) - \mathbb{1}(x \geq y)]^2 \, dx\]- \(CRPS(F, y)\): The Continuous Ranked Probability Score for the forecast \(F\) and the observed outcome \(y\).
- \(F(x)\): The cumulative distribution function (CDF) of the forecast, evaluated at \(x\).
- \(\mathbb{1}(x \geq y)\): The indicator function which equals 1 if \(x \geq y\) and 0 otherwise.
- \(dx\): Infinitesimal change in \(x\), indicating integration over the entire real number line.
Energy Score
Energy Score (ES) is a proper scoring rule to measure calibration and sharpness of the predicted distributions. Defined as
\[\text{ES}(P, \textbf{x}) = E_{ \textbf{X} \sim P} \| \textbf{X} - \textbf{x} \| - \frac{1}{2} E_{ \textbf{X, X'} \sim P} \| \textbf{X} - \textbf{X'} \|\]This paper shows that the energy score outperforms the softmax confidence score on common OOD evaluation benchmarks.
The energy score is parameter-free measure, which makes it easy to implement, especially for distributions whose analytic expressions are unavailable or difficult. Another result of this property is that it is not directly differentiable w.r.t. parameters.
Interval specific: Mean Interval Score
A common way of using probability forecasts for decision making is translating it to confidence intervals. We will go through two of the
The Mean Interval Score is a metric used to evaluate the accuracy and calibration of probabilistic forecasts. It measures the average width of prediction intervals relative to the observed outcomes.
Keep in mind that this is a specialized metric for evaluating prediction intervals, and it may not be as commonly used as metrics like Brier score or log-likelihood in all contexts.
In a prediction interval, a model not only predicts a point estimate but also provides a range of values within which the actual outcome is expected to fall with a certain confidence level.
The Mean Interval Score is defined as follows:
\[MIS = \frac{1}{n} \sum_{i=1}^{n} (U_i - L_i) + \frac{2}{\alpha} \sum_{i=1}^{n} (L_i - y_i)1_{y_i < L_i} + \frac{2}{\alpha} \sum_{i=1}^{n} (y_i - U_i)1_{y_i > U_i}\]Where:
- \(n\) is the total number of observations or data points.
- \(U_i\) is the upper bound of the prediction interval for the i-th observation.
- \(L_i\) is the lower bound of the prediction interval for the i -th observation.
- \(y_i\) is the actual observed value for the \(i\)-th observation.
- \(\alpha\) is the confidence level of the prediction interval (e.g., 0.95 for a 95% confidence interval).
- \(I(\cdot)\) is the indicator function, which equals 1 if the condition inside the parentheses is true, and 0 otherwise.
The Mean Interval Score penalizes prediction intervals that are too wide or too narrow compared to the actual outcomes. It also accounts for cases where the actual outcome falls outside the predicted interval.
Interval specific: Winkler Score
The Winkler score is another fun one for confidence intervals / regions, and can be easily extended to forecasts in higher dimensions. It is essentially a a metric measuring the overlap between two sets.
\[WS = \frac{2 \times |A \cap B|}{|A| + |B|}\]where \(A\) and \(B\) are binary sets and | \(\cdot\) | denotes the cardinalities of the sets.
The Winkler Score ranges from 0 to 1, with 1 indicating complete overlap and 0 indicating no overlap between the sets.
tangent: Is KL divergence a proper scoring rule?
No. The main difference between KL divergence (and other entropy metrics) as opposed to PSRs is that it measures difference between two distributions, where as PSRs calculates a score with the predictive distribution and observations. Often we do not have the ground truth distribution, so we would have to approximate the KL divergence.
KL is also not strictly proper: While KL divergence is proper in the sense that it is minimized when the predicted distribution matches the true distribution, it is not strictly proper because it doesn’t have a unique maximum. In other words, multiple predicted distributions can yield the same KL divergence value.
This is not to say that we should not use KL divergence as a measure of accuracy. It is very helpful for optimization and model selection because of its sensitivity to small differences, and can be used along with other PSRs.
Discussion
I hope I’ve made the case for using proper scoring rules as evaluators of probabilistic predictions, and provided a grimoire of useful scores.
It is worth noting that, while being proper is helpful for model comparison, it is just one of the desirable property for a metric. This paper from ICML 2023 raised the important point that we also need to pay attention to metric’s discriminative performance in the settings of the task. They showed that in a multivariate time series forecasting context, the energy score and CRPS fail to capture correlation structures between the variables, and are not sensitive to discrepancies in higher moments. Some scoring rules also appears complementary in their discriminative emphases, so it is worth having an ensemble of metrics for reliably measuring the correctness of forecasts.
Happy hacking!
Extended Readings
-
Strictly proper scoring rules, prediction, and estimation.. Gneiting, Tilmann, and Adrian E. Raftery. The OG proper scoring rules paper.
-
Valid prediction intervals for regression problems. Nicolas Dewolf, Bernard De Baets, Willem Waegeman. A survey of probablistic forecasting models including Bayesian methods (GP, BNN), ensemble methods, direct estimation methods (quantile regression), and conformal prediction methods. They introduce the methods clearly and compare the advantages and disadvantages of each.
References
Michel Kana, “Uncertainty in Deep Learning. How To Measure?” blogpost, 2020
Balaji Lakshminarayanan, Dustin Tran, and Jasper Snoek, “Uncertainty and Out-of-Distribution Robustness in Deep Learning” Talk at NERSC youtube, 2020
Gneiting, Tilmann, and Adrian E. Raftery. “Strictly proper scoring rules, prediction, and estimation.” pdf Journal of the American statistical Association 102.477 (2007): 359-378.
Victor Richmond Jose, Robert Nau, & Robert Winkler. “Scoring Rules, Generalized Entropy, and Utility Maximization” slides, Presentation for GRID/ENSAM Seminar, 2007
Marcotte, Étienne, Valentina Zantedeschi, Alexandre Drouin, and Nicolas Chapados. “Regions of Reliability in the Evaluation of Multivariate Probabilistic Forecasts.” pdf ICML 2023